Allgemeine Informationen
Liebe Oster-Monster,
am 20. April veranstalten wir ein hybrides Meetup mit Thomas Hütter als Sprecher. Thomas wird uns mit einem großartigen Vortrag zum Thema Datenvisualisierung beglücken und wir freuen uns schon sehr darauf, ihn in unserer RG begrüßen zu dürfen.
Für diejenigen, die sich gerne vor Ort treffen möchten, streamen wir den Vortrag bei ML!PA Consulting GmbH in der Fredersdorfer Str. 10.
Ihr könnt euch online unter diesem Link einwählen: Klick mich!
Wir freuen uns auf euch.
======= English version =======
Dear Easter-monsters,
on April 20th we will have a hybrid meetp with Thomas Hütter as speaker. Thomas will share a great presentation about visualizing data with us. We are very happy to wecome him to our group.
For those of you who would like to meet in person, we will stream the talk at ML!PA Consulting GmbH in Fredersdorfer Str. 10.
Use the following link to join the meeting: Click me!
We are looking foward to seeing you.
Program
50 ways to show your data
„A picture is worth a thousand words“ – well, that is especially true when it comes to analyzing data. Visualization is the quick and easy way to uncover the big ‘picture’ in your data and the R ecosystem has a lot to offer in this regard.
They may not add up to exactly 50, but in this session I’ll show you lots of compelling visualizations produced with the help of the ggplot2 package and friends – and their usual small effort of code. We will start beyond the usual bar, line or scatter plots.
Instead our screen will show diagrams that always made you think „How do they do that?“. We will see waterfall diagrams, violins, parliament diagrams, marginal histograms, maps and more… and you’ll get the code to reproduce everything.
Referenten

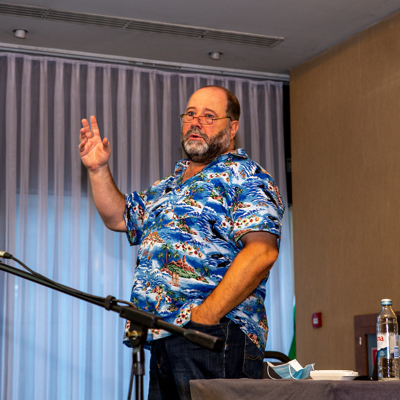
Thomas Hütter
Thomas Hütter hat einen Abschluss als Diplom-Betriebswirt, ist aber seit den Tagen von dBase und Turbo Pascal ein „data explorer“ und Entwickler mit Leib und Seele.Er kam mit dem SQL Server zum ersten Mal mit V6.5 in Berührung und hat Covering Indizes eingesetzt, schon bevor sie zum Feature wurden.
Thomas entwickelte viele Jahre Navision/Dynamics/Business Central systeme (seit 2001, ein Jahr bevor Microsoft Navision übernahm), ist PASS Mitglied seit 2006, beschäftigt sich mit R seit 2014 (dem Jahr bevor Microsoft Revolution Analytics kaufte) und mit der Power Platform seit 2020. Er ist als Entwickler, Berater, Projektleiter und als Sprecher auf SQL-Events in Europa unterwegs.
Veranstaltungsort
Kontakt
bke@sqlpass.de
mra@sqlpass.de
Anmeldung
Online bookings are not available for this event.
